
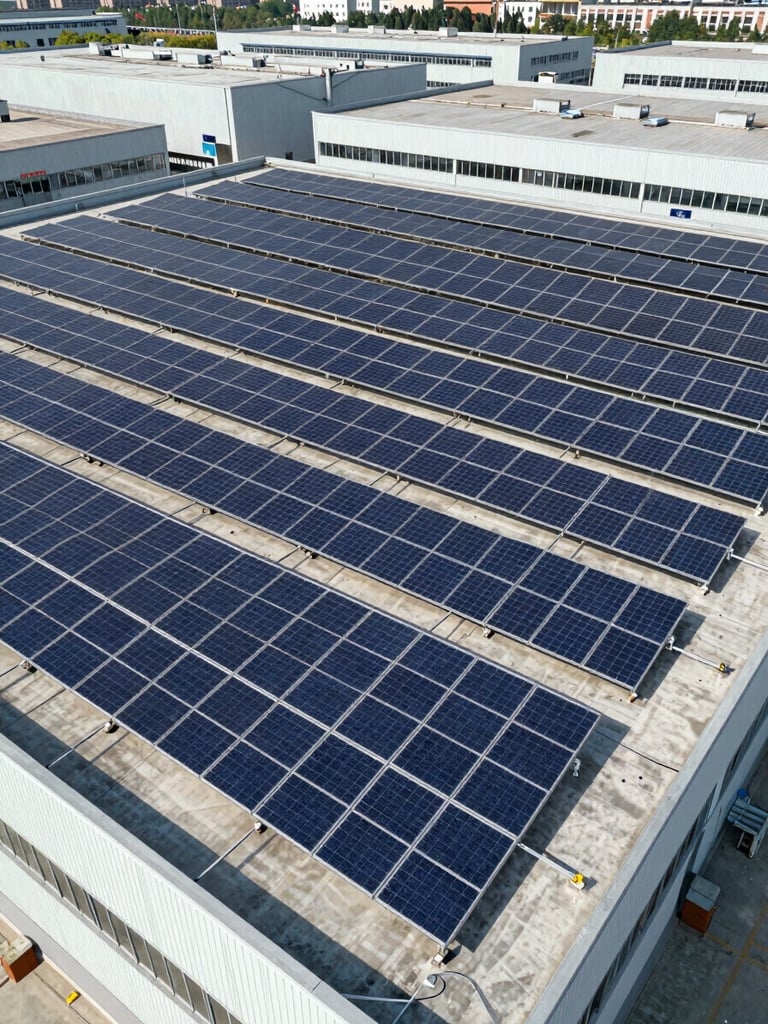
Every System Listed Here is Live and Metered.
Install date, system size, annual output, and verified utility savings — published for each project. No projections, no estimates.
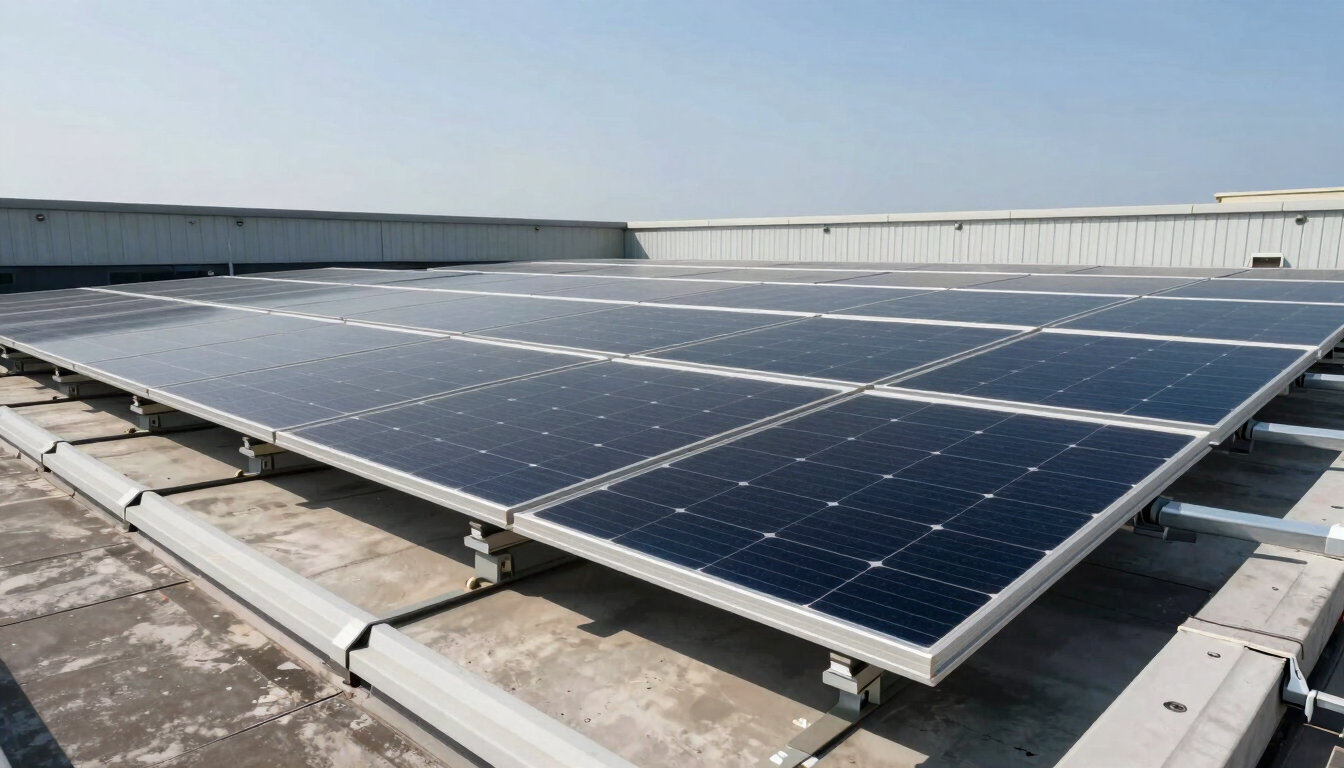
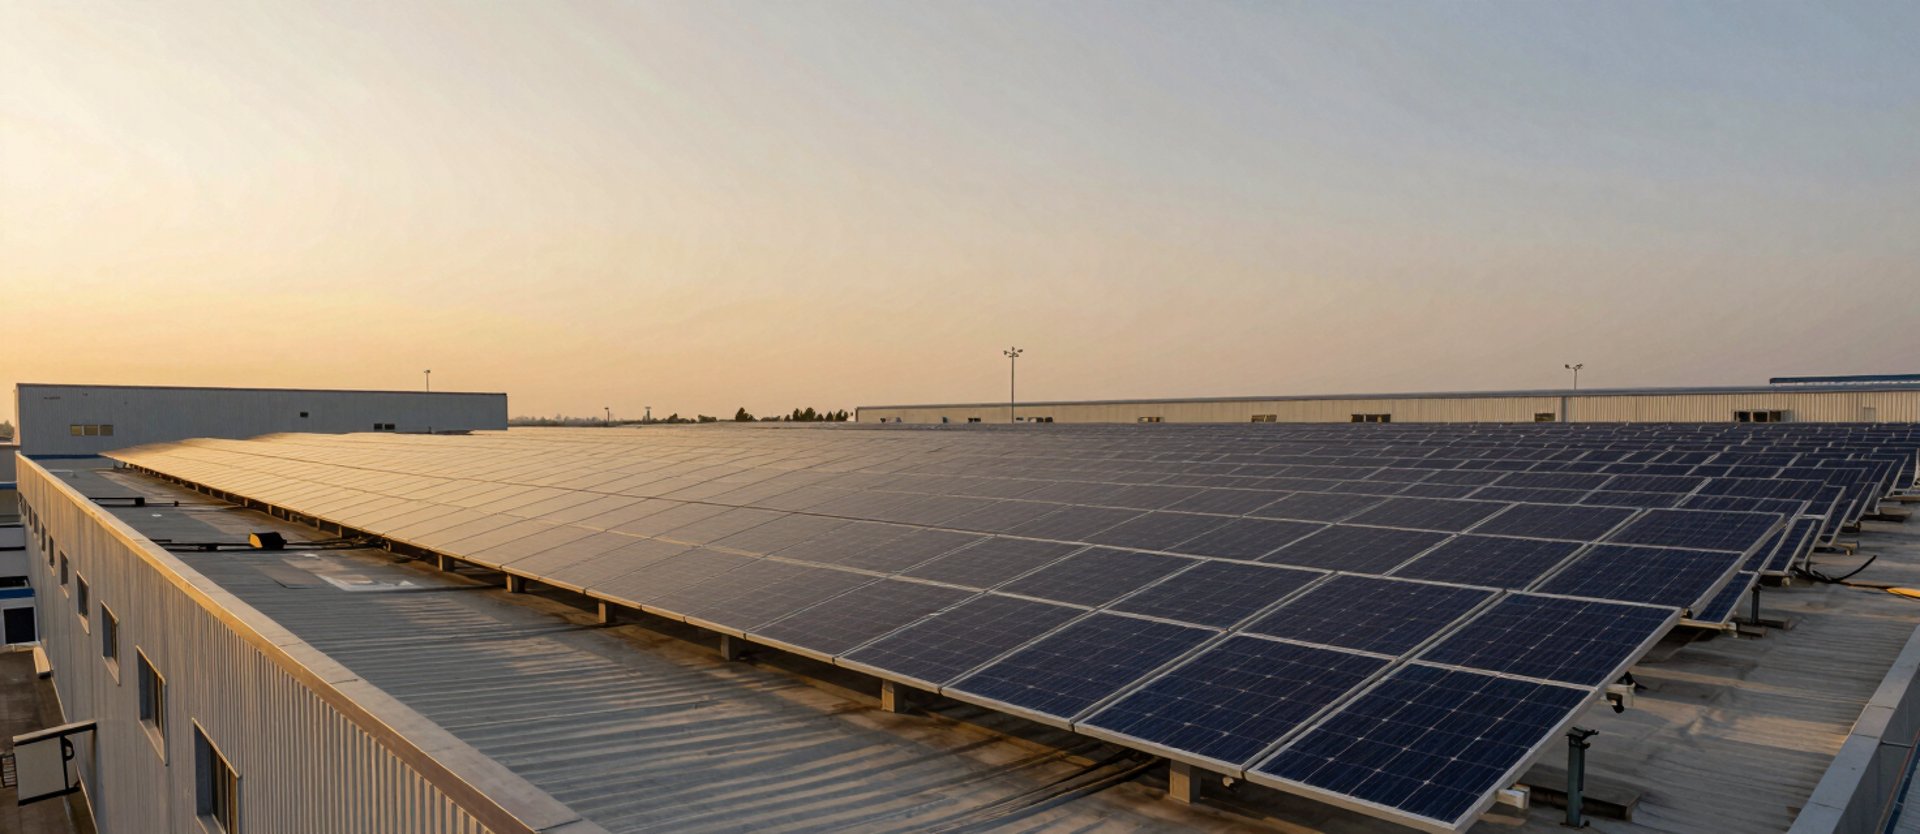
Rooftops, Ground Mounts, Mixed-Use — Multiple States.
480 kW
1.2 MW
320 kW
750 kW
Installed: March 2021. Annual output: 612 MWh. Payback period: 6.2 years. Current utility bill down 71%.
Installed: September 2022. Annual output: 1,680 MWh. Payback period: 5.8 years. Owner's annual bill reduced by $194k.
Installed: June 2022. Annual output: 398 MWh. Payback period: 6.7 years. Utility costs down 58% year-over-year.
Installed: January 2023. Annual output: 1,125 MWh. Payback period: 5.4 years. Owner verified $162k annual savings.
Installed Cost, Incentives, and Owner's Current Bill — Per Project.
Avg. 6.0-year payback across all sites.
Across every completed installation, owners reached full payback in under seven years with actual meter data on file.
Facility-specific engineering means no two systems share the same cost architecture. Each project entry carries the installed cost, incentives applied, and the owner's current annual utility figure.
2.75 MW
6.0 yrs
4 States
Total capacity installed across all completed commercial and industrial sites.
Average payback period. Verified from install date against metered utility savings, not estimates.
Active installations across Ohio, Texas, Pennsylvania, and Arizona — rooftops and ground mounts.
Your facility is the next data point.
We assess your site, size the system, and give you the installed cost and projected payback before any commitment. Actual numbers, not a brochure.
Solvren Energy
Installed, metered, and producing — on your roof right now.
QUICK LINKS
GET IN TOUCH WITH US
info@solvren.com
+1 800 555 0174
Commercial & industrial sites, North America
(C) 2026 Solvren Energy-Real systems. Actual data. No projections.
Installed — metered — producing